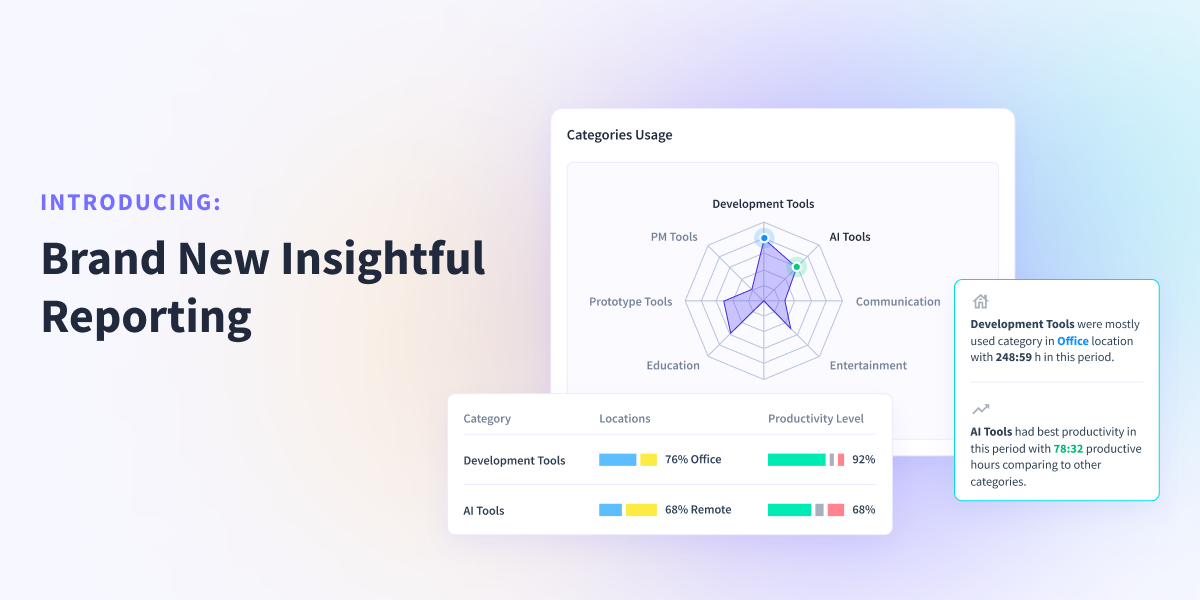
Transform Your Workplace with Insightful’s New Reporting Feature


Key Takeaways:
💡 The new Category Report and Tags Report provide invaluable insights into time spent on different work categories, tools, software, apps, and websites, facilitating data-based decision-making.
💡 With easy-to-understand data visualization, users can quickly identify important work patterns, productivity trends, and areas for improvement, empowering them to make meaningful changes in the workplace.
💡 Insightful's monitoring employee software enables users to prioritize tasks more effectively, minimize distractions, and maximize efficiency for enhanced workforce productivity.
Read time: 7 minutes
Wouldn’t it be neat if instead of sifting through endless dashboards you could access all your data in a well-crafted “highlights reel’’? Good news: you can now.
We at Insightful are thrilled to announce Work Type Reports, the latest addition to our platform. The feature was designed to help users make data-based decisions more easily than ever.
Work Type Reports were developed in our ongoing commitment to enhancing workforce analytics. With this new capability, Insightful users will gain a holistic overview of employee activities across different departments, locations, and tools. The best part? All relevant data is neatly organized into comprehensive charts, skimmable stats, and bullet points.
The new reports are designed to draw your attention to where it needs to be: workforce patterns. With actionable insights laid out on a digital platter, you can make meaningful changes in your workplace and pave the way for deep, focused, productive work.
Readily Available Actionable Insights
With Work Type Reports, we’re introducing not one, but two new features: Category Report and Tags Report. These enhancements provide invaluable insights into time spent across different work categories, tools, software, apps, and websites.
The new features are located in the Reports section of the Insightful platform. Once you click on the new Work Type tab, you'll access the Category Report—a comprehensive breakdown of time spent on different tools and software that are divided into 16 predefined categories. Similarly, Tags Report provide insights based on how you previously marked each app and website using our Tags feature.
The Category Report visualizes how time is spent across various work categories, allowing you to identify significant work patterns. Similarly, the Tags Report provides a deeper understanding of how apps and websites with specific tags influence work habits and efficiency.
Both reports share the same layout that includes:
- A radar chart
- A highlights section
- A category/tags usage overview
With these releases, Insightful users can access actionable insights with a click of the mouse. These reports make it easy to interpret data and workforce patterns with comprehensive visualization.
Once you understand exactly how much time employees spend in each category or tag, you can make changes that matter. The data collected can help you encourage better work habits, recognize and eliminate distractions, and ultimately, enhance productivity.
Easy-to-Understand Data Visualization
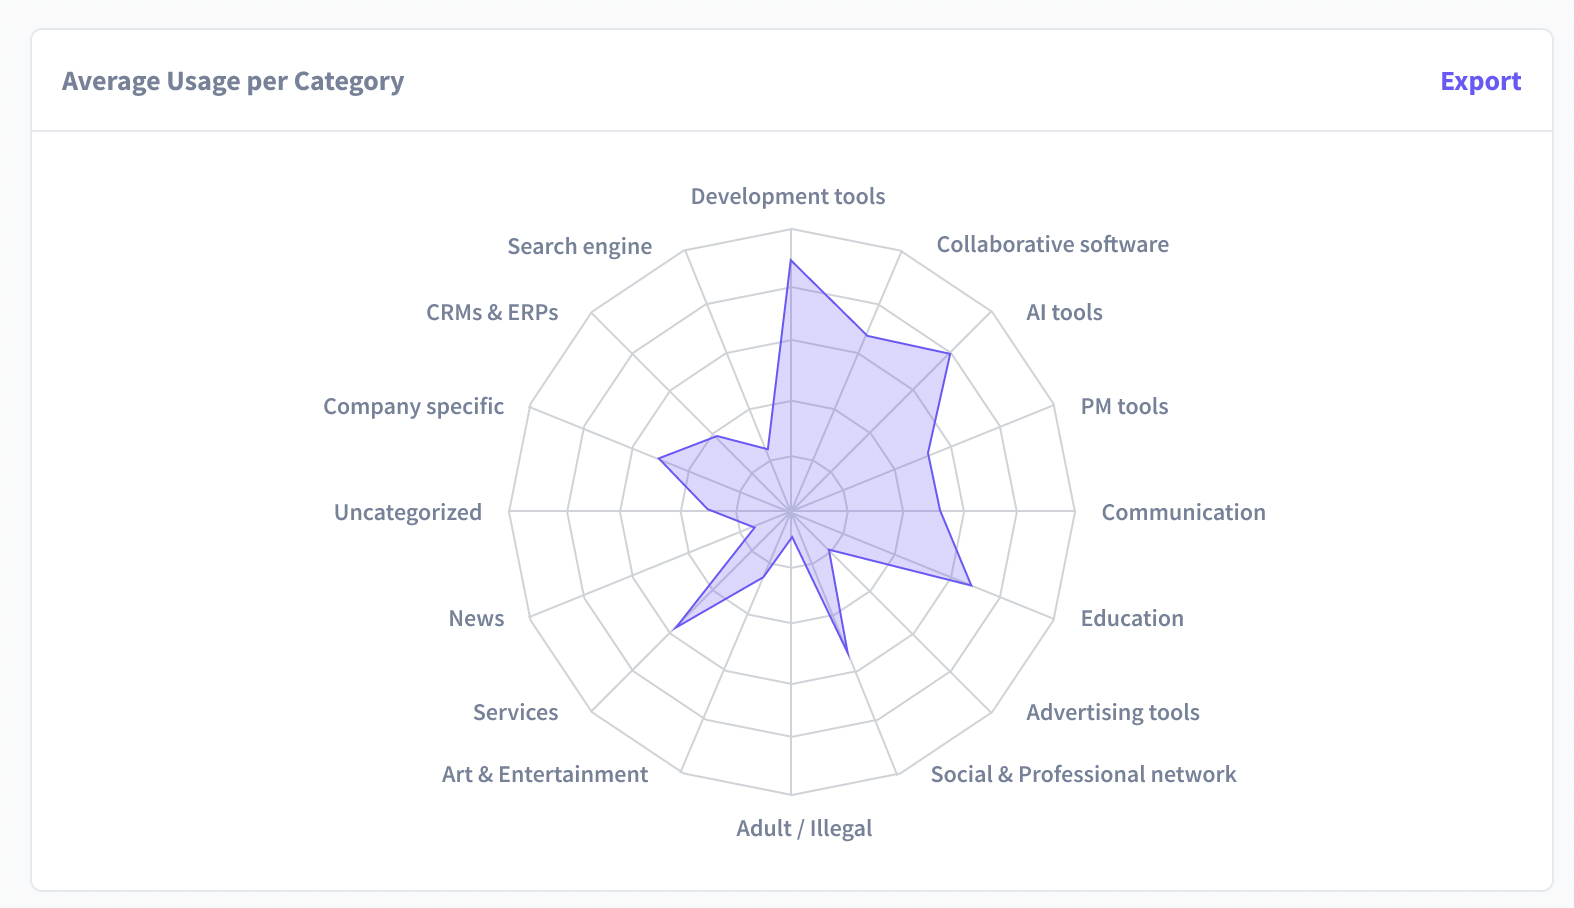
The radar chart visually depicts how much time employees spend using different tools, software, apps, and websites.
This feature offers a snapshot of the average usage of each Category or Tag per employee. You can also select a specific time period for a more in-depth analysis.
With this data visualization, you can quickly identify important work patterns and time management trends across different departments. For example, you can see which categories or tags receive the most employee attention and which may require further optimization.
Key Takeaways from Relevant Data
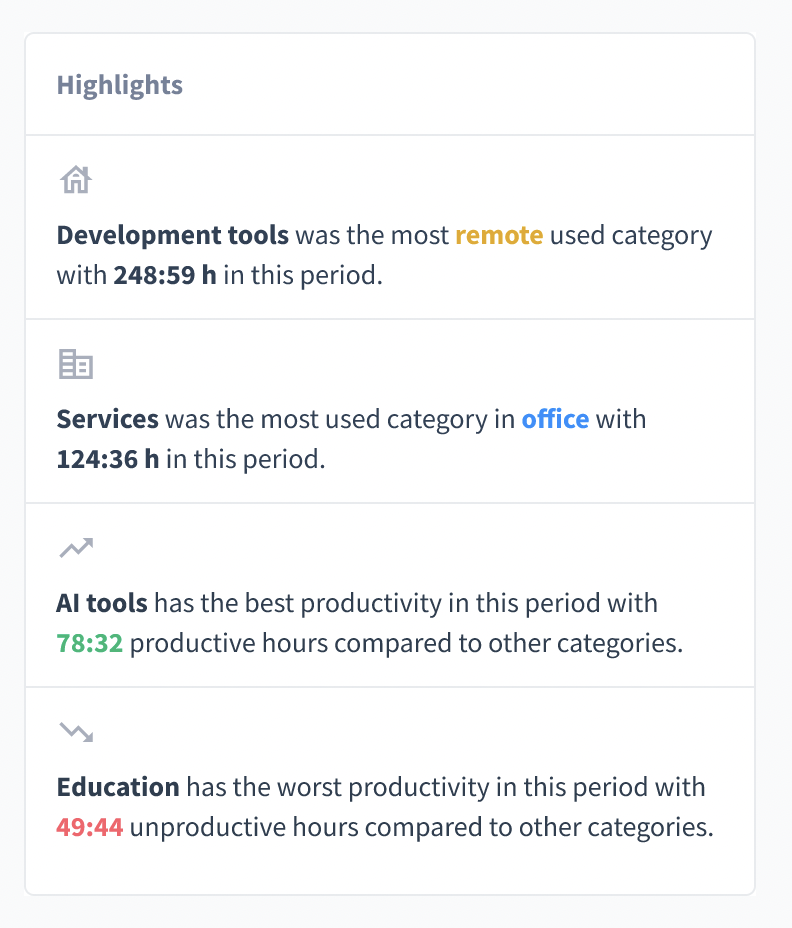
The Highlights section offers a condensed summary of key insights derived from the data presented in the reports.
Here you can find actionable information about productivity levels across different categories and tags. Based on the highlighted data, you can easily identify trends and pinpoint areas of improvement or optimization.
The Highlights section sets apart categories or tags with the most productive or the least productive hours. This helps bring your attention to evolving work patterns, allowing you to adapt business strategies according to the most recent shifts in employee behavior.
Plus, with this new feature, you’ll learn which categories are more suitable for different work environments. You’ll be able to see exactly which software, tools, apps, and websites are used more by employees working from home compared to those in the office, helping you provide the right resources for each setting and boost productivity.
Detailed Data Comparison Between Two Periods
As part of the new reporting feature, you can compare the data gathered in two distinct time periods for even better results. This comparative analysis provides valuable insights into how category and tag usage has changed over time.
You can select any two periods and compare usage patterns between different months, quarters, or even years to identify productivity trends.
With compared periods, you can pinpoint which categories have experienced the most notable changes in total hour usage between the selected time frames. This allows you to understand how priorities have evolved over time and identify areas where adjustments may be needed.
Additionally, you can analyze productivity levels within each category over the compared periods. By comparing productivity metrics, you can identify improvements or declines in efficiency, allowing for targeted interventions to optimize workflow management.
Comprehensive Overviews of Usage Patterns
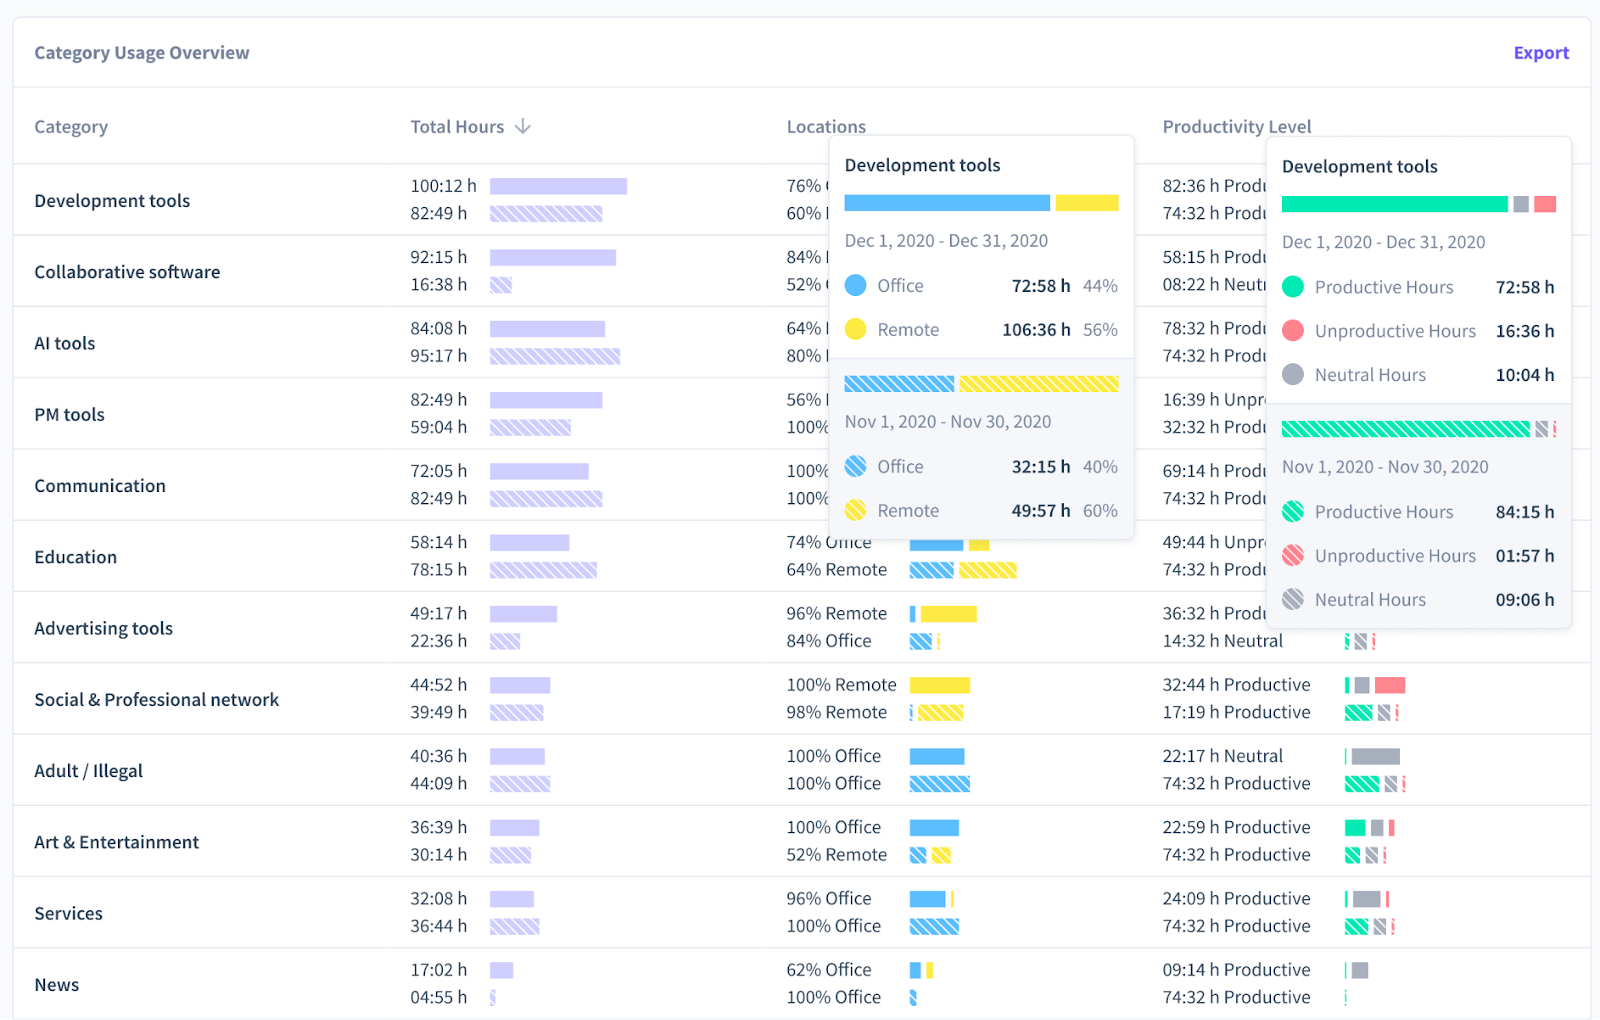
The Category Usage Overview feature offers a comprehensive summary of important work behaviors and patterns. The list provides detailed insights into how time is spent across each work category and website usage.
All 16 predefined categories are listed in descending order based on total hours spent. In addition to this, you can see:
- Locations: Overall usage in remote locations vs. in the office
- Productivity Level: Total hours broken down into productive, unproductive, and neutral
With locations, the one with the higher usage percentage is shown first. You can also hover the cursor over each section to access all data.
This detailed breakdown offers a unified and comprehensive understanding of how productivity varies across different work environments and tasks.
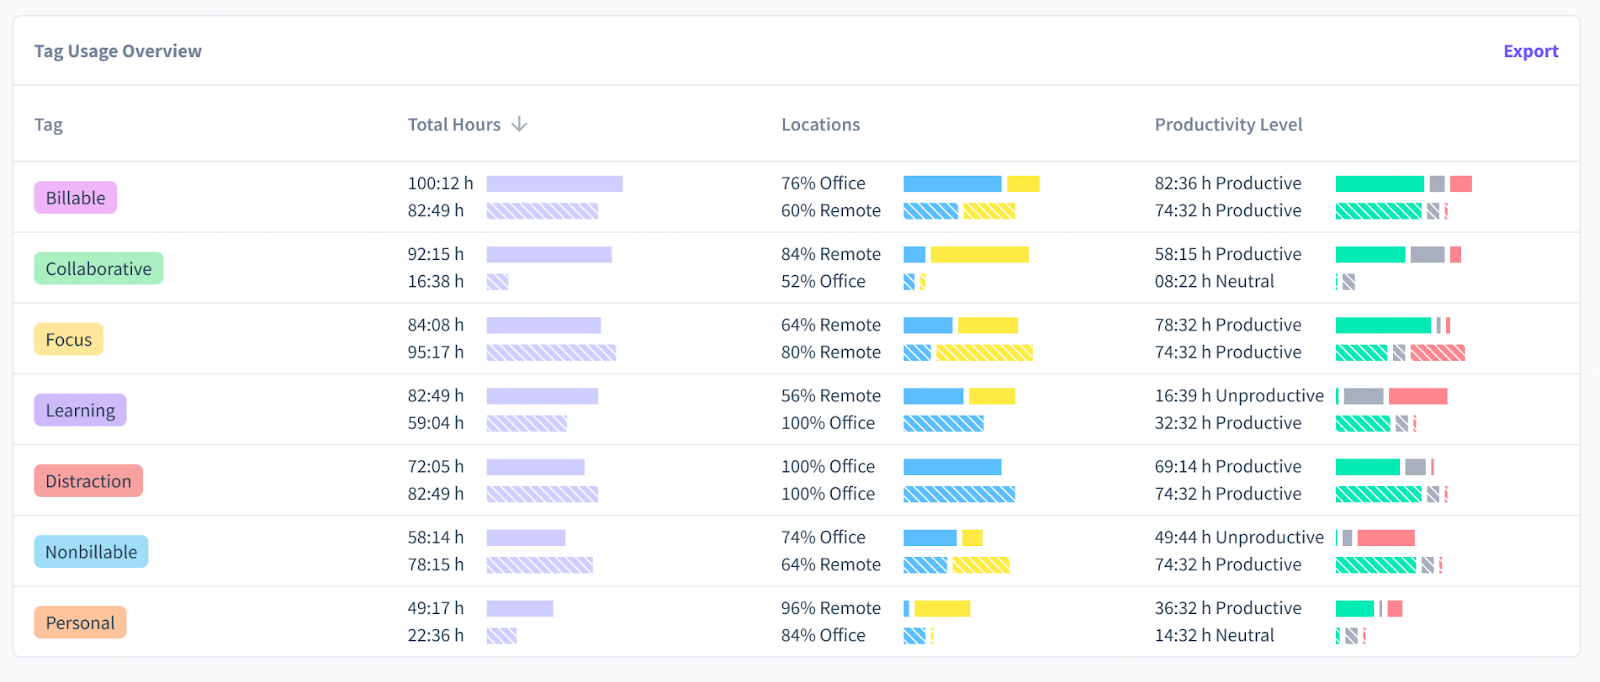
The Tags Usage Overview contains the same type of data. The only difference is—since you can have as many tags as you want—the overall list can be longer. Also, the tags are color-coded according to your preferences for an even better overview!
Clear Insights into Work Activities
With Insightful’s new reporting feature, you can access and extract actionable insights about workforce patterns at the click of the mouse.
The enhancement gathers all the data from different departments, locations, software, apps, and websites into one place to provide a holistic understanding of exactly how time is being spent within your organization.
With Category Report, you can easily monitor employee computer activity during a project life cycle and identify spikes in the usage of certain tools and platforms. This can lead you to manage resources more effectively, ensuring each team has the necessary support to handle their workload and see any project to successful completion.
With readily available insights, you can easily adapt your strategies to accommodate different project demands, enhancing the overall productivity within your organization.
Ultimately, the data from Insightful’s new reports helps you track employee performance and encourage better work habits, leading to an environment conducive to deep, productive work.
Improved Task Prioritization with In-Depth Reports
Insightful’s new reporting enhancements offer a new approach to task prioritization, based on in-depth analysis.
Category Report and Tags Report offer precise and actionable insights into how employees distribute their resources. You can see exactly how much time each team spends on specific apps or software and how that contributes to their overall performance, i.e., productivity level.
As a result, you may notice that some employees are wasting too much time on non-essential apps or even worse—getting distracted.
The ability to compare usage patterns over time allows you to track changes in task prioritization and productivity levels. Once you successfully outline the usage patterns during busy seasons or project deadlines, you can adjust priorities accordingly.
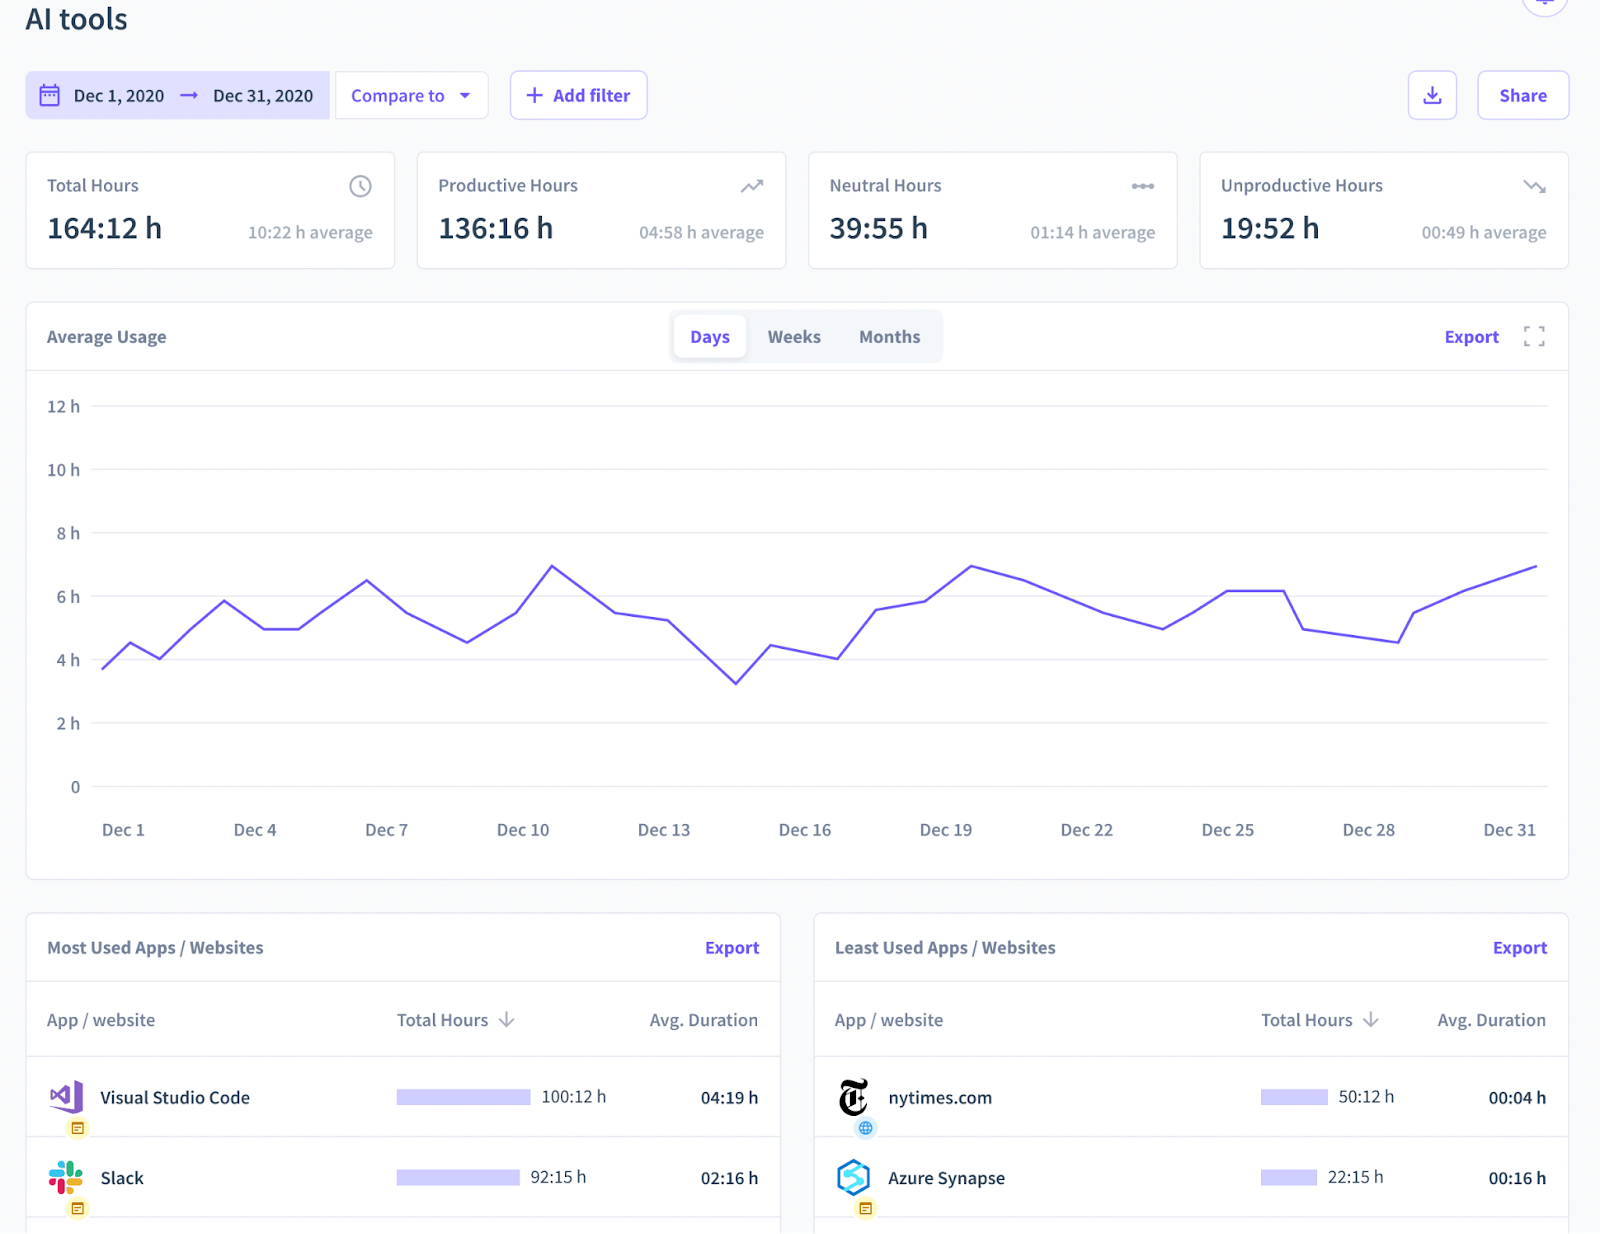
Optimized Use of AI Tools
The new and enhanced reporting feature offers insights into the usage patterns of AI tools within your organization. You can track how AI tools are applied across different departments, along with other relevant software and applications.
In the Category Report section, you can see exactly which AI tools are being used most frequently, how much time employees spend using them, and whether there are any significant changes in usage over time.
The in-depth analysis allows you to make more informed decisions about AI tool deployment and optimization. For example, you can easily notice if certain AI tools aren’t being used to their full potential, which suggests a need for additional training for employees. On the other hand, if there's a noticeable increase in usage, you can explore the reasons behind this trend and ensure there are enough resources to support it.
Comparing AI tool usage with other categories such as productivity tools or communication platforms equips you with actionable insights for more strategic decision-making. You might find that using a particular AI tool more often leads to better productivity in some departments. This could encourage you to look deeper into how the tool can be applied in other areas of work.
Maximized Efficiency with Zero Distractions
With the introduction of the Category Report and Tags Report, users now have powerful tools to streamline workflows and remove any distractions.
You can easily detect websites or apps—like social media platforms or online games—that tend to divert your team's focus from important tasks. Thanks to the Distractions Tag, you can accurately identify these productivity obstacles and mark them as such for future reference.
This insight allows you to take targeted action to minimize distractions and enhance employee focus. For example, you may want to block access to distracting websites during work hours or educate your team on time management techniques.
With distractions minimized, employees can dedicate their focus to meaningful work, resulting in heightened productivity and organizational success.
What's next?
Get ready for an even deeper dive into the inner workings of your organization with our upcoming in-depth reports for each Category and Tag. We plan to release these enhancements in Q2, completing the Work Type Reports rollout.
Each individual report will provide the following data:
- Detailed Information: Provides total time spent, productive hours, neutral hours, and unproductive hours for a specific category.
- Employee Insights: Offers average usage per day/week/month per employee, along with breakdowns by location.
- App/Website Usage: Highlights the most and least used apps/websites within the category, along with top active employees/teams.
That’s not all! We plan to enhance the current sharing options to facilitate open collaboration and communication within organizations.
With features designed to promote transparency and efficiency, Insightful continues to empower businesses to use the full potential of workforce analytics. Stay tuned for these exciting updates as we continue to revolutionize the way data can be explored and harnessed.
.webp)
.webp)
.webp)