Insightful Categorization: Turn Employee Time Data Into Better Workforce Decisions


Key Takeaways:
- Insightful's categorization sorts employee app and website activity into 16 predefined work-type categories, showing leaders the kind of work happening, not just which tools are open.
- Employee time data categorization gives operations leaders context that raw logs cannot, making activity comparable across roles for staffing, workload, and process decisions.
- Admins can reassign any app's category and apply custom, color-coded tags, so a developer's productive set looks different from a salesperson's by design.
- Categorized data surfaces work patterns fast: rising admin share signals workload imbalance, while a falling core-work share can flag burnout before attrition hits.
- Insightful clients report up to a 95% increase in team-wide productivity, with TRG raising productivity 76% in six months using workforce analytics activity classification.
What is Employee Time Data Categorization, and Why Does it Matter?
In workforce analytics, categorization refers to the process of classifying raw app and website activity into labeled work types. Categorization gives managers context that raw logs cannot provide. Instead of a simple list of apps opened, you see how employee hours are split across the kinds of work a team actually does: core tasks, administrative work, communication, and collaboration.
That distinction matters more than you might think. Most organizations are not short on workforce data; they are short on data they can act on. In HR.com’s State of People Analytics 2025-26, only 45% of HR professionals said their analytics improve talent and business decisions, down from 57% two years earlier. The bottleneck isn’t the collection of data. It’s turning that activity into something a leader can act on.
The stakes are concrete. Industry research puts knowledge workers at roughly 60% of their time on “work about work” rather than the skilled work they were hired for. If you can’t see that split, you can’t manage it. A report showing four hours in a CRM tells you little on its own. The same amount of time, with productivity labels flagging it as core sales vs. admin work, changes the decision you make about it.
How Does Categorization Differ from Basic App and Website Tracking?
Raw tracking tells you a browser and a spreadsheet were open, and leaves further investigation up to you. Categorized data states the work type, so the same activity is comparable across a developer, a support agent, and a finance analyst.
For operations and HR leaders, that comparability is what makes the data actionable in staffing, workload, and process decisions, instead of a report that needs decoding first.
What’s New with Insightful’s Categorization Feature?
Categorization is a core feature of Insightful’s Workforce Analytics, not an add-on. Insightful automatically maps every tracked app and website to one of 16 predefined categories. Admins can adjust categories. Custom tags let teams label activity on their own terms.
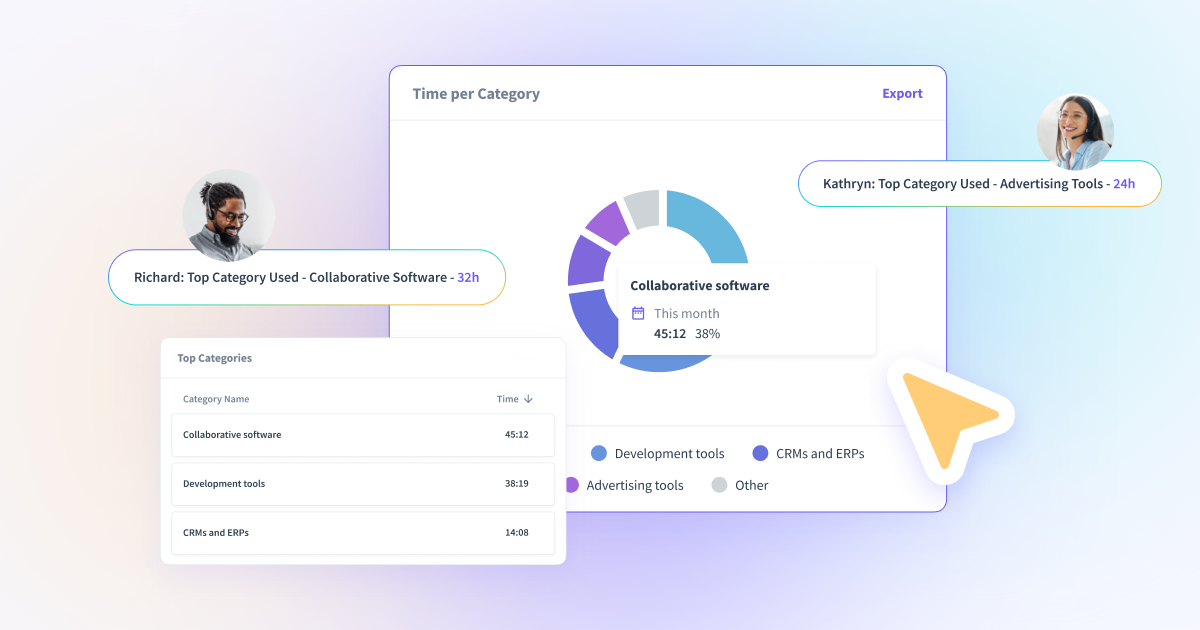
Insightful shows how time splits across categories at both the individual and team level. You see the share of hours going to communication, collaboration, CRM work, research, and the rest, without checking each app by hand.
Here are a few examples of how Insightful maps common tools:
- Slack → Communication
- Trello → Collaborative Software
- HubSpot → CRMs & ERPs
- Bloomberg → News
- Google → Search Engine
This lets you answer concrete questions fast. Is the sales team really spending hours a day in CRM work? How much of the HR team’s day goes into communication tools?
How Do You Customize Categories and Tags in Insightful?
Automatic assignment is the starting point, not the limit. Admins can change the category for any app or website when a different productivity label fits the work, so that the data reflects how your teams operate rather than a generic default.
Custom tags go a step further. You can tag activity at the app and website level using your own terms, color-code those tags for quick scanning, and filter reports by them. A forecasting tool can be tagged “strategic planning”; a distraction blocker can be tagged “deep work.”
Admins can also designate specifically tagged activities as core work, which sharpens how much time teams spend on primary responsibilities. The result is role-specific reporting: a developer’s productive set looks different from a salesperson’s, and the categories reflect that.
How Does Categorization Speed Up Work Pattern Identification?
Categories appear as a dedicated column across the Insightful reporting dashboards you already use: Productivity, Productivity trends, Screenshots, Activity Logs, and Audit Logs.
Patterns that used to take manual cross-referencing, like a team drifting into communication tools mid-quarter or research activity clustering in the first hour of the day, surface as soon as you scan the column.
How Does Categorized Data Support Better Decision-Making?
Category-level data turns into specific operational moves. A few examples by role:
- An operations manager spots that one team spends 35% of its hours in admin against a 15% average, and rebalances the workload.
- A Finance or BPO leader separates billable core work from non-billable admin for accurate client invoicing.
- An HR or workforce planner reads a declining core-work share against a rising communication share as an early burnout signal, before it shows up as attrition.
These are the decisions activity logs alone rarely support. Insightful clients have turned that visibility into results: TRG raised productivity 76% in six months, and clients report an average of $2.5 million saved through new efficiencies.
What Can You See in Insightful’s Categorization Reports?
Categorization feeds dedicated reports that pull category and tag data into one view. You get a breakdown of where time goes by work type, can download reports as PNG files to share with other admins and managers, and can share them in-app for a faster review cycle.
Usage-trend views show how category patterns shift across a day, week, or year. That means a Q1 spike in planning tool activity is just as visible as a mid-morning peak in communication tool usage.
How Do You Track Location-Based Productivity by Category?
Categorization reports by work location, so you can compare the same work type across remote and in-office settings. If social media use runs higher in the office, or core work is concentrated more within remote teams, the category split shows it. Paired with Insightful’s location insights, this gives hybrid teams a like-for-like read on how work mode affects how time is actually spent.
Categorization as a Foundation for Work Intelligence
Categorization is just one feature of Insightful, a true work intelligence platform that offers leaders deep, decision-grade data across their organization.
Many customers initially come to Insightful for raw time tracking needs, but begin using it for increasingly complex (and meaningful) ops decisions once they realize how deep the data goes. Raw tracking records what happened. Categorization adds meaning by grouping activities into work types. Work intelligence uses that structured base to explain why output looks the way it does, and what has to change.
The need is real. Microsoft’s 2025 study, Breaking Down the Infinite Workday, found that employees are interrupted every two minutes during core hours, about 275 times a day. Unlabeled activity logs can’t tell you whether those interruptions are productive collaboration or fragmentation. Categorized data can.

See how Insightful’s categorization turns employee activity into decision-ready workforce intelligence. Start your free 7-day trial, no credit card required.
How Does Insightful’s Categorization Compare to Other Workforce Analytics Tools?
Most monitoring-first tools classify activity as productive, unproductive, or neutral. That answers whether time was well spent, but not what kind of work it was. Insightful’s categorization adds the work-type layer on top, which is what makes the data usable for staffing and workload decisions rather than solely for productivity scoring.
What Does Categorized Time Data Change for Operations Leaders?
Categorization changes the unit of analysis from app names to real work throughput. You can see where a team’s hours actually go, separate core work from overhead, spot burnout and billing leakage early, and compare work modes on equal terms. That’s the difference between a dashboard you read and data you decide on.
Ready to move beyond raw activity tracking? Book a demo with Insightful and see how categorization gives your team the context to make smarter workforce decisions.
FAQs
What are the 16 predefined categories in Insightful?
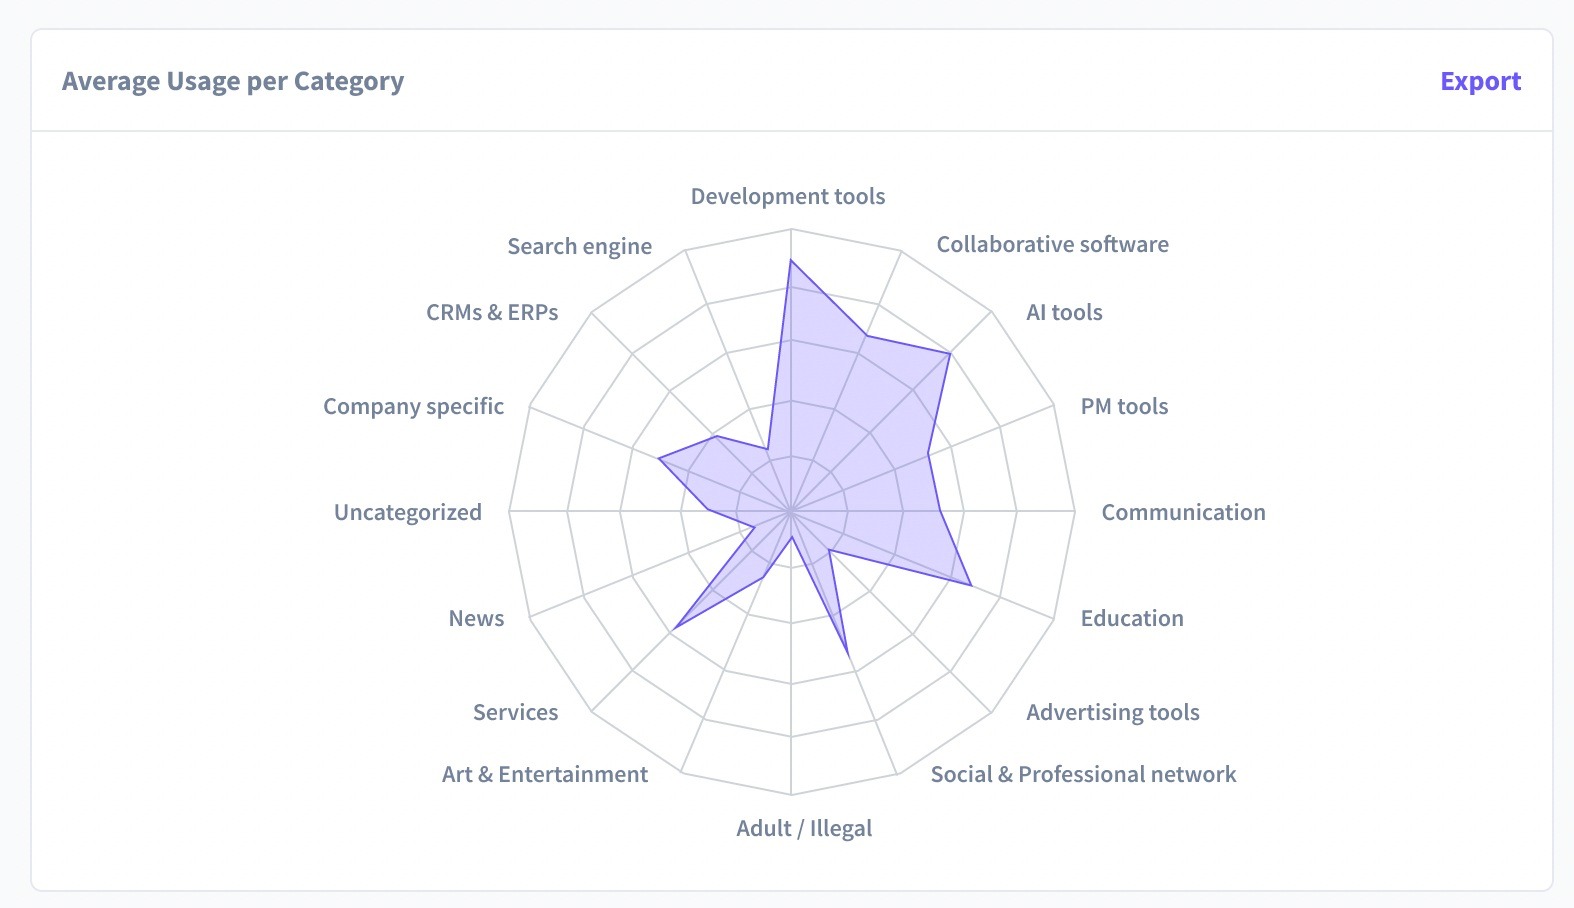
Insightful automatically sorts tracked apps and websites into 16 work-type categories: Development Tools, Collaborative Software, AI Tools, PM Tools, Communication, Education, Advertising Tools, Social & Professional Network, Adult/Illegal, Art & Entertainment, Services, News, Company Specific, CRMs & ERPs, Search Engine, and Uncategorized. These cover the common kinds of work a team does. Each app or website lands in one category by default, and admins can reassign it whenever a different label better reflects how a specific team uses that tool.
Can admins change the category assigned to an app or website?
Yes. Automatic assignment is the starting point, not a fixed rule. Admins can reassign the category for any app or website so the data matches how their teams actually work. A tool Insightful files under research, for example, might be core work for one department. Changing it keeps reports accurate and makes time comparisons across roles meaningful rather than generic.
How do tags differ from categories in Insightful?
Categories are the 16 predefined work types Insightful assigns automatically. Tags are custom labels you create and apply at the app and website level, in your own terms, such as strategic planning or deep work. Tags can be color-coded and filtered, and admins can mark tagged activity as core work. Categories give you a standard structure; tags let you tailor reporting to your workflows.
Which pages in Insightful show the categorization column?
The categorization column appears across the pages teams already use: Productivity, Productivity Trends, Screenshots, Activity Logs, and Audit Logs. It also shows on individual employee pages. Reading the work type in context, rather than only on a separate report, is what speeds up pattern recognition, since you see what kind of work an activity represents without cross-referencing app names by hand.
How does categorization support remote and hybrid team management?
Categorization reports by work location, so leaders can compare the same work types across remote and in-office settings. That surfaces differences that a headcount or hours view misses, such as collaboration concentrating in the office or research running higher remotely. For distributed teams, it gives a consistent read on how work mode affects where time goes, supporting fairer workload and staffing decisions.
Can managers filter productivity reports by category in Insightful?
Yes. Reports can be filtered by category and by custom tag, so managers can isolate a single work type, such as admin or core work, and see how it is distributed across people, teams, and locations. Filtering also drives exportable category and tag reports, which managers can download as PNG files or share in-app for review.
.webp)
.webp)